(2)_770.jpg)
Website analysis tools - results vs. practicality vs. reality - part 1
There are many services available to ‘review’ your website or online application. This can range from analysing the technical aspects of a site to how good the reading level of the English is. Tools can now even track the movements of your users on the site to indicate how ‘useable’ it is.
Utilising these services both during your site development and at regular intervals after launch are important tasks. Understanding their purpose will also help ensure future content on your site continues their recommendations.
Popular analysis tools include HotJar, SiteBeam, Google Webmaster Tools and Screaming Frog – each providing a different type of analysis.
However, one analysis tool – PageSpeed Insights by Google, is often referred to, and provides a simple example of where optimising your website can quickly become a lost cause for no practical gain.
PageSpeed Insights
The concept of this free tool (https://developers.google.com/speed/pagespeed/insights/) is to analyse the performance of your site and how quickly it ‘loads’ on mobiles and desktops.
It’s a very good tool, and helps to give a decent indication of how a site is performing. Conceptually useful, as a slow site may put off users whilst also penalising you on search engines.
The scoring is simple – red is bad, yellow is ok and green is good.
The Holy Grail of Performance
So, if you can’t get ‘green’ across the board on PageSpeed all is lost right? Hours, weeks and man hours should be spent ensuring no-one waits a millisecond more than they have to?
Not really. Without a doubt, optimising your site performance is extremely important – but valuable time may be lost chasing the perfect score when it simply isn’t necessary.
The problem with this is the same problem with all analysis tools: They assume too much.
Understanding your audience
This is simple. Tools don’t know your business or your audience. If you aren’t expecting your site to be popular in particularly rural areas or underdeveloped countries with dial up modems then speed of page load starts to become less of an issue. Internet delivery speeds have never been better, and are getting faster on mobile platforms, so getting upset over 0.001 ms speed differences is a lost cause.
Additionally, if you are selling photography or rely on large landscape images to illustrate your products and services, expect slower load times. Yes, more can be done, but your audience won’t be expecting miracles if they want to see great imagery as well.
Practicality
A lot of suggestions that the tools will make assume you have full control over your hosting. Hopefully you do, but it’s not always the case.
Also, not everyone is an expert, but your web team is very rarely in complete control of your website content – something that Content Management Systems (CMS) were designed to alleviate. However, it can be unreasonable to expect every user to know the best methods for image compression and web standards when the use a CMS.
Large Sites and Caching
You are also not always in control of your site’s external resources. Although you may provide expertly optimised content – your other providers may not. Services such as live chat or even Google Maps may be providing content that doesn’t play by their rules.
However, its impractical to remove them if they are a core part of your site or what your site requires. At the end of the day functionality may exceed performance, so you have to decide what’s more important to you.
Appearance
Your site may just be spewing out text and providing simple instructions. However, appearance may be important to you. Often, performing optimisation can have an adverse effect on the ‘first impression’ of your site if content is snapping around as the page catches up with the resources. It might be quicker, but you have to again decide if it’s worth it.
Law of Averages
Finally, the PageSpeed algorithms that you are measured against are based on averages – as are most analytics. Average mobile screen size, average internet speeds and so on. These technologies can, and do, change frequently and your demographic may be very different.
What practical differences will optimisation do?
Don’t get us wrong – optimisation is important – what we are saying is don’t just assume the details of a report are verbatim.
Let’s take a practical example of PageSpeed for a website and see what real life results we can expect to achieve as a result of their advice.
The experiment:
- Take our website as a snapshot and place on new hosting
- Record how long it takes to load
- Run PageSpeed Insights and apply their advice
- Record how long it now takes to load
Non optimised
Ok, out of the box, our website came in with a relatively low score across mobile (40) and desktop (51):
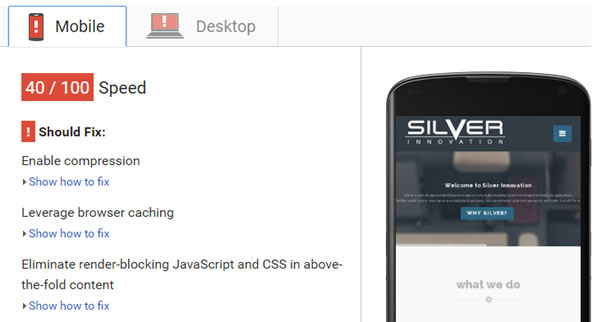
Ouch. Pretty damming right?
Ok – so how long does the page actually take to load? Let’s ask Chrome on a decent internet connection:
![]()
Hmmmm. Ok, 4.3 seconds. Hardly the end of the world, especially as we have a lot of big imagery on the website - most of which is important as it showcases our abilities.
Working through PageSpeed Insights
Ok, none the less, let’s work through the critical PageSpeed suggestions and see what it can bring us:
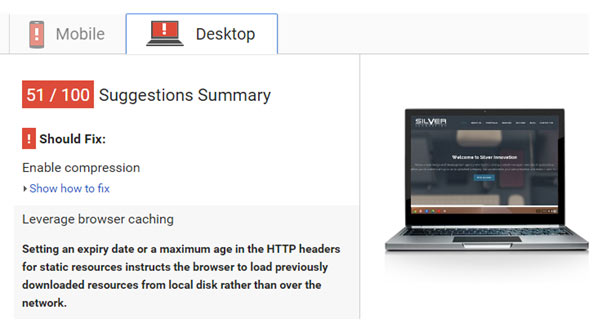
Enable Compression
The first suggestion is to ‘enable compression’. This forces the server to compress content before it sends it to the user. The concept being smaller files are received faster.
Our PageSpeed score is now 70 for desktop!

Woohoo – our website must now be considerably faster! Google Chrome says:
![]()
Er, no. We are just 0.02 seconds faster.
So, not quite the ground shattering improvement we hoped for….
What has happened? Why has the needle barely moved? As you can see the amount of data has dropped from 3Mb to 2.4Mb, so the files are definitely smaller. However, the server now has to do a lot of work before sending files across so that means takes it takes longer to respond.
Long term, this is a good tactic none the less as these files will be cached, but practical results for a first time visitor are negligible.
Leverage browser caching
PageSpeed’s suggestion of implanting browser caching isn’t going to make the site any faster for first time visitors. Its more geared for helping repeat visitors by informing their browser about the expected expiry dates of content so it knows the optimal time to store them for before attempting to retrieve them again.
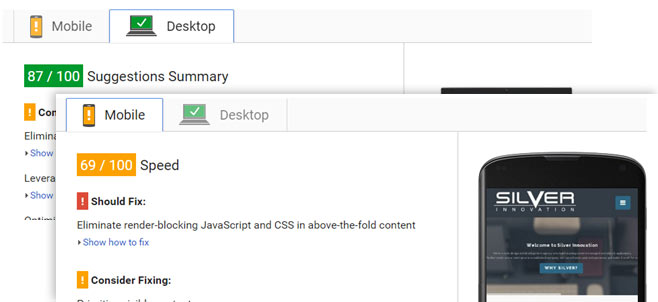
As suspected, despite not decreasing the load time, our score has significantly improved (now 87 on desktop and 69 on mobile).
So, in honesty, these changes were quick to make. A single, small, text file added to our hosting and we have gone from red to yellow/green with minimum effort.
In our next part we will concentrate on the final ‘should fix’ suggestion for mobile – render blocking JavaScript and CSS.
Conclusions so far
Hopefully this has given you some insight on what to think about website optimisation tools and their impact. It’s important to stress that a well built and optimised site is important, and shouldn’t be simply underestimated, but chasing the perfect score isn’t always worthwhile and can often go against the usability and function of a site.
Be sure to discuss what’s critical for your site in how your website is received by your consumers and help prioritise what can and what cannot be sacrificed in search of the Holy Grail….
Come back soon for Part 2.